Link building remains one of the most powerful strategies in SEO (Search Engine Optimization). Among the many techniques available to build backlinks, infographics link building has become a standout method. It not only serves as an effective way to drive organic traffic but also helps in building high-quality backlinks. This strategy, when executed properly, can significantly boost the authority of your website, improve rankings, and drive engagement.
In this article, we will explore the concept of infographics link building, how it works, its benefits, and a step-by-step guide to help you implement this strategy effectively.
What is Infographics Link Building?
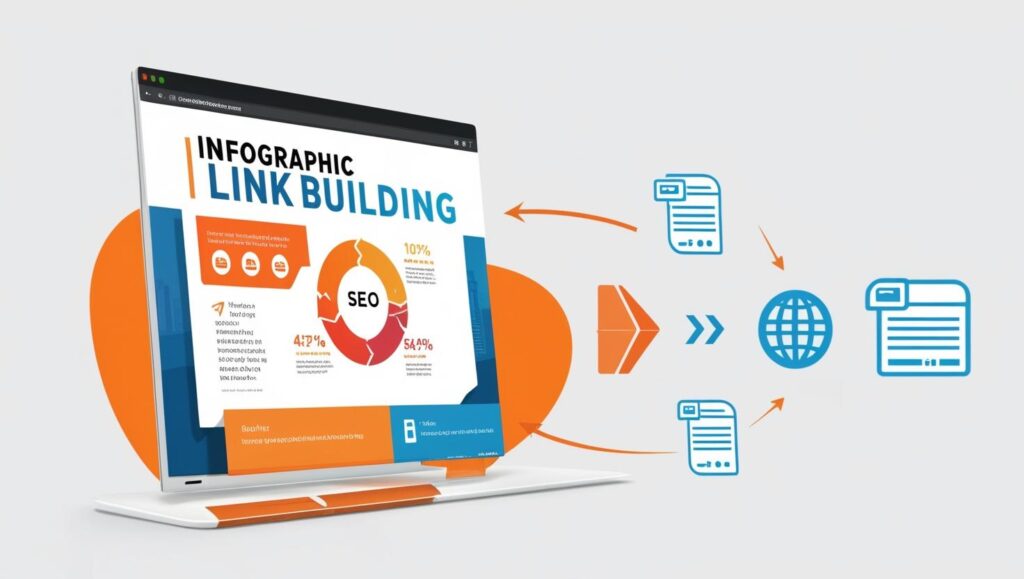
Infographics link building is a strategy that involves creating and distributing infographics to attract backlinks. Infographics are visually appealing content pieces that combine text, statistics, and graphics to present information in an easily digestible format.
By creating high-quality and valuable infographics, businesses can encourage other websites, blogs, and platforms to link back to their pages as a source. These backlinks, when coming from authoritative websites, contribute positively to your site’s SEO efforts.
In essence, infographics act as a tool for educating your audience while simultaneously enhancing your site’s link profile.
Why Infographics are Effective for Link Building
Infographics have several unique qualities that make them an effective tool for link building:
- Visual Appeal: Infographics combine text and visuals, which make them much easier to digest than a wall of text. Humans process visual information faster, and infographics help convey complex data in an easily understandable way.
- Shareability: People are more likely to share visual content. If your infographic is informative and visually appealing, it will likely be shared across social media platforms and linked back to from other websites.
- Engagement: Infographics tend to get more attention than regular blog posts or articles. When users engage with your infographics, it increases the chances of them sharing or linking back to your content.
- Credibility and Authority: Infographics are often seen as credible sources of information. When authoritative websites or bloggers cite your infographic, they are implicitly endorsing your data and ideas, which helps build your site’s authority.
- Link Attraction: Well-crafted infographics, especially those containing valuable statistics or data, have a higher chance of getting backlinks from other authoritative websites in your niche.
- Long Shelf-Life: Unlike some content that may quickly lose relevance, infographics can retain their value for an extended period. Well-made infographics can continue to attract backlinks and shares long after their publication.
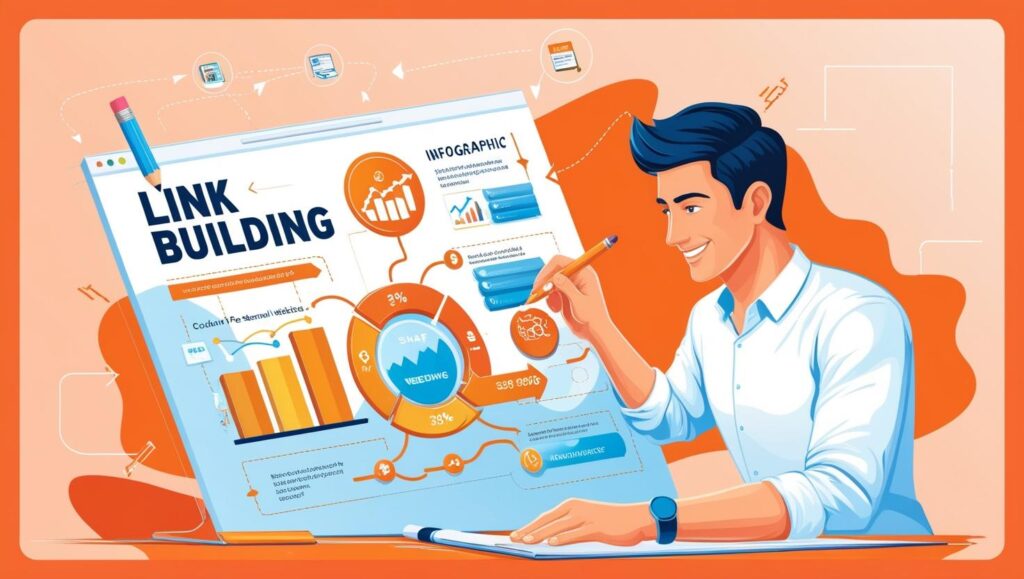
How to Create Effective Infographics for Link Building
Creating infographics requires a strategic approach to ensure that they not only attract attention but also generate backlinks. Below are the essential steps to create compelling infographics for link building:
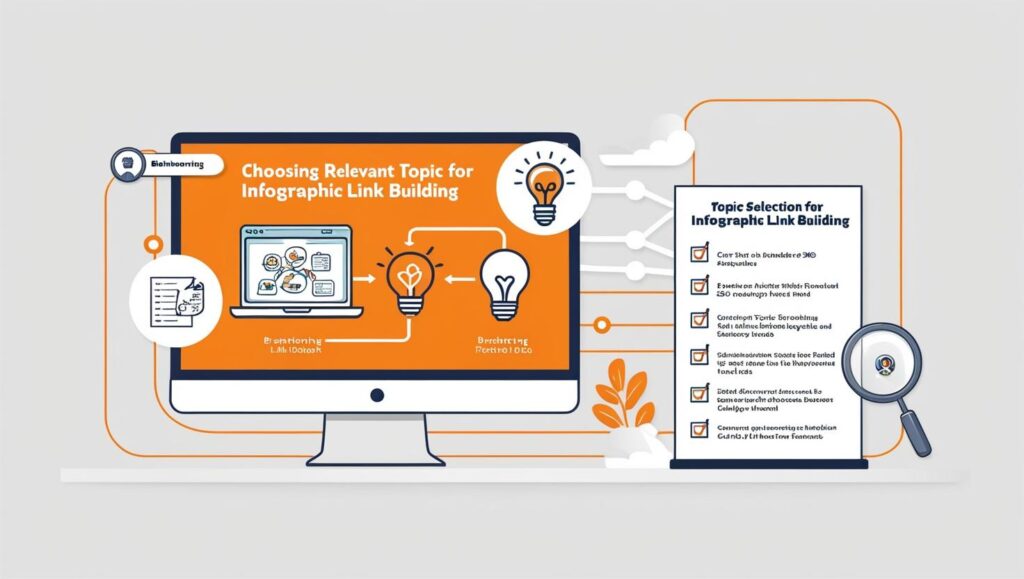
1. Choose a Relevant Topic
The first step is to select a topic that is highly relevant to your target audience. The infographic should focus on an issue or subject that is informative, useful, and engaging. Ideally, it should address a common problem or provide valuable insights in your industry.
Here are a few tips for choosing the right topic:
- Research industry trends: What are people talking about in your industry? What are some of the common questions or concerns?
- Focus on evergreen content: Choose topics that remain relevant over time, so your infographic continues to attract attention and backlinks.
- Use data-driven content: Infographics that showcase statistics or research tend to get more traction, as people like to reference factual information.
2. Design with the User in Mind
The design of your infographic should be aesthetically pleasing, easy to follow, and visually balanced. A well-designed infographic helps ensure that your audience engages with it, shares it, and most importantly, links to it.
When designing your infographic:
- Keep it simple: Avoid cluttering the infographic with too much text. Focus on clear headings, bullet points, and engaging visuals.
- Use brand colors and fonts: Ensure that your infographic reflects your brand’s style guide. This helps with brand recognition.
- Use quality visuals: Include high-quality icons, images, and charts. Make sure your visuals help communicate the message clearly and aren’t just added for decoration.
3. Ensure Data Accuracy
The effectiveness of your infographic depends largely on the accuracy of the data you present. Infographics that include misleading or inaccurate data can harm your credibility and deter others from linking back to your site.
Ensure that all statistics, facts, and figures used in your infographic are sourced from reputable and authoritative websites or studies. Additionally, always provide citations and references for the data included in your infographic.
4. Optimize for SEO
To increase the chances of your infographic being discovered by search engines, you need to optimize it for SEO. Here’s how:
- Title and Alt Text: Give your infographic a descriptive title that includes relevant keywords. Also, add alt text to the image, which helps search engines understand the content of the infographic.
- Create a landing page: Host your infographic on a dedicated landing page with additional text that provides context. This helps with SEO and ensures that your infographic gets indexed by search engines.
- Embed code: Provide an easy-to-use embed code for your infographic. This allows other sites to quickly embed it on their pages, giving you backlinks.
5. Promote Your Infographic
Once your infographic is ready, it’s time to distribute it. The more places you can get your infographic shared and linked to, the better it will perform for link building.
Here’s how to promote your infographic:
- Reach out to influencers: Send your infographic to bloggers, influencers, and journalists who might find it relevant and valuable to their audience. Offer them an exclusive or personalized reason for sharing it.
- Submit to infographic directories: There are directories specifically for infographics where you can submit your work. Popular platforms include Visual.ly, Infographic Journal, and Cool Infographics.
- Post on social media: Share your infographic across your social media channels, and ask others to share it as well. The more shares it gets, the higher the chances of it being linked to from other sites.
- Leverage email outreach: Send emails to bloggers and content creators who might be interested in your infographic. Offer them the infographic as a valuable resource and suggest they link back to your site.
Measuring the Success of Infographics Link Building
After distributing your infographics, it’s important to track the success of your efforts. The main goal of infographics link building is to generate backlinks, so you should focus on the following metrics:
- Backlink count: Use tools like Ahrefs, Moz, or SEMrush to track how many backlinks your infographic has generated.
- Referral traffic: Check your analytics to see if the infographic is driving traffic to your website. More traffic indicates that people are engaging with your content.
- Social shares: Keep track of how often your infographic is shared on social media. This can give you an idea of its viral potential.
- Rankings: If your infographic is highly relevant and well-optimized, you should start seeing improvements in rankings for the target keywords associated with your infographic.
Common Mistakes to Avoid in Infographics Link Building
While infographics can be incredibly effective, there are some common mistakes you should avoid:
- Overcomplicating the design: Infographics are meant to simplify complex information, not add to the confusion. Keep your design clean and focused on clarity.
- Choosing irrelevant topics: If the topic of your infographic isn’t relevant to your audience or industry, it’s unlikely to attract backlinks.
- Ignoring promotion: Simply creating an infographic isn’t enough. You need to actively promote it to get the backlinks and traffic you desire.
- Not providing attribution: Failing to attribute your sources or include citations can reduce the credibility of your infographic and make it less likely to be shared.
FAQs
1. What is the role of infographics in SEO?
Infographics play a vital role in SEO by making content more shareable and engaging. Their visual appeal attracts backlinks, which are crucial for boosting search engine rankings and improving a website’s authority over time.
2. How do infographics generate backlinks?
Infographics attract backlinks when others find your visual content valuable and relevant. By sharing or embedding your infographic on their site, they provide a backlink, helping improve your website’s SEO performance.
3. What types of topics work best for infographics?
Data-driven, informative, and evergreen topics work best for infographics. Topics that solve common problems or provide valuable insights, such as industry trends, statistics, and how-to guides, tend to attract more backlinks and shares.
4. How can I make my infographic stand out?
To make your infographic stand out, focus on high-quality design, clear messaging, and valuable content. Use eye-catching visuals, reliable data, and a well-organized layout to grab attention and encourage sharing and linking.
5. What tools can I use to create infographics?
Popular tools for creating infographics include Canva, Piktochart, and Adobe Spark. These platforms offer templates and design features that make it easy to create professional-looking infographics, even without design experience.
6. How can I track the success of my infographics?
You can track the success of your infographic by monitoring the number of backlinks it generates, tracking referral traffic using Google Analytics, and checking its social media shares. Tools like Ahrefs can also help track backlinks.
7. Are there any risks with infographics link building?
The main risks include creating low-quality infographics or choosing irrelevant topics. Poor design or misleading data can damage your credibility. It’s essential to ensure accuracy and promote your infographic effectively to avoid these pitfalls.
8. What are the best infographic submission sites for building backlinks?
Infographic submission sites like Visual.ly, Infographic Journal, and Cool Infographics are excellent platforms to submit your infographics. These sites allow you to showcase your visual content, which can help attract backlinks and improve your SEO efforts.
9. How does infographic submission benefit SEO?
Infographic submission helps by allowing you to share valuable, data-driven visual content with a wider audience. When your infographic is featured on authoritative websites, it generates infographic links that contribute to improving your website’s domain authority and search engine rankings.
10. How do infographic links help improve website traffic?
Infographic links are valuable backlinks that are generated when other websites share or embed your infographic. These links direct more traffic to your website and contribute to improving your SEO performance, resulting in better search engine rankings and more organic visitors.
Conclusion
Infographics link building is an excellent strategy for driving traffic, gaining high-quality backlinks, and boosting your SEO efforts. By creating valuable, informative, and visually engaging infographics, you can significantly enhance your website’s authority and visibility.
To succeed with this strategy, you need to focus on creating high-quality, data-driven infographics, optimizing them for SEO, and promoting them across various platforms. With the right approach, infographics can help you build a robust link profile, drive organic traffic, and ultimately achieve long-term SEO success.
Latest Posts
- Is Yoast SEO Premium Worth It for Your Website’s Optimization Needs?
- What Is Reciprocal Link in SEO and How Does It Affect Rankings?
- What Is SEO Intelligence and How It Helps Improve Search Strategies
- How Is Ranking Different When Comparing PPC vs SEO for Better ROI
- How Local SEO Increases Profits and Drives More Traffic to Your Site