Published by XSquareSEO Research Team | May 2026 Dataset: 43 major publishers | January 2012 – May 2026 | 173 months
Table Of Contents
The Number That Changes Everything
Between 2015 and 2026, the combined organic keyword rankings of 43 major U.S. publishers grew by 530%. Their combined organic traffic grew by 68%.
That gap — 530% versus 68% — is the central finding of this study. It means publishers ranked for dramatically more keywords every year while receiving proportionally less traffic for each one. The more they ranked, the less each ranking was worth.
This is not a story about artificial intelligence. It is not a story about the last two years. The data shows the structural break between ranking and receiving traffic happened in 2016 — eight years before AI Overviews became part of the public conversation.
This study tracks organic keyword counts and organic traffic estimates across 43 major publishers from January 2012 through May 2026, calculating traffic per keyword efficiency for each publisher across 173 consecutive months.
What Traffic Per Keyword Efficiency Measures
Traffic per keyword efficiency is a simple ratio: estimated organic traffic divided by total ranking keyword count for a given period.
A publisher with 1,000,000 monthly traffic and 500,000 ranking keywords has an efficiency of 2.0. A publisher with the same traffic but only 100,000 keywords has an efficiency of 10.0.
Efficiency measures how much traffic a publisher extracts from its ranking footprint. A declining efficiency number means keywords are becoming less valuable — the publisher is ranking for more but converting fewer rankings into visits.
This metric has rarely been tracked longitudinally at scale. The 14-year dataset assembled for this study makes it possible to trace not just whether efficiency changed, but precisely when it changed and how consistently that change appeared across different publisher types.
The 2016 Cliff
The most significant finding in this dataset is not gradual. It is a cliff.
Median traffic per keyword efficiency across all 43 publishers:
| Year | Median Efficiency | Year-on-Year Change |
|---|---|---|
| 2012 | 11.63 | — |
| 2013 | 11.20 | -3.7% |
| 2014 | 19.07 | +70.3% |
| 2015 | 16.99 | -10.9% |
| 2016 | 2.29 | -86.5% |
| 2017 | 1.97 | -14.0% |
| 2018 | 2.48 | +25.9% |
| 2019 | 1.96 | -21.0% |
| 2020 | 2.34 | +19.4% |
| 2021 | 2.76 | +17.9% |
| 2022 | 2.22 | -19.6% |
| 2023 | 2.07 | -6.8% |
| 2024 | 1.99 | -3.9% |
| 2025 | 2.24 | +12.6% |
| 2026 | 2.48 | +10.7% |
In 2015, the median publisher received approximately 17 visits for every keyword it ranked for. In 2016, that figure collapsed to 2.29 — an 86.5% decline in a single year.
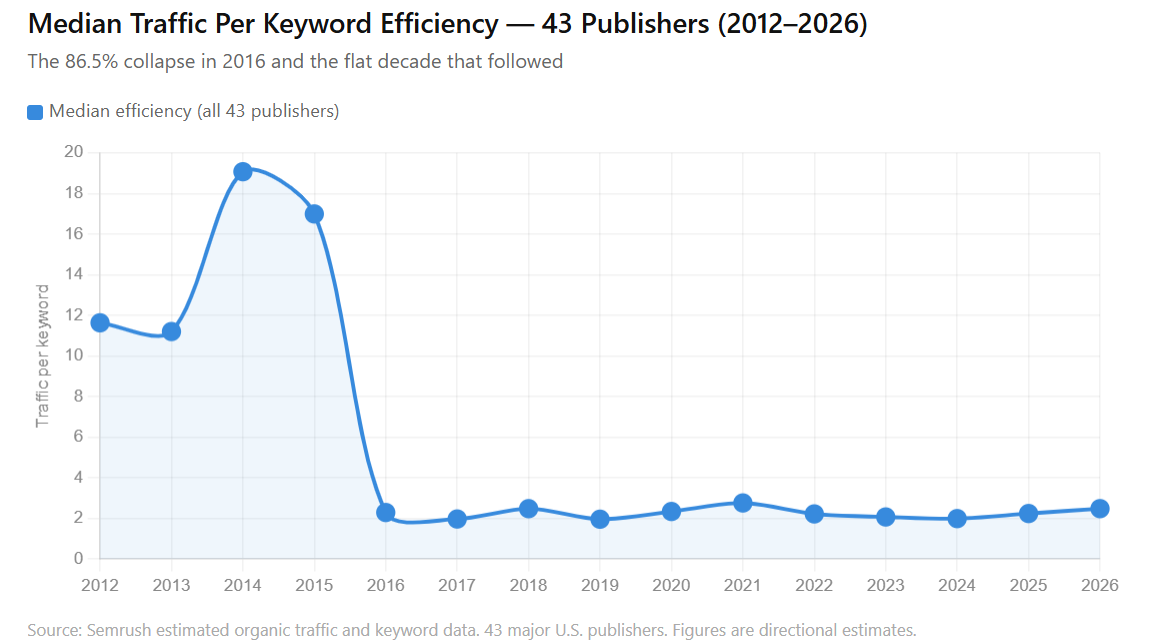
From 2016 onward, efficiency never recovered. For ten consecutive years the median has oscillated between 1.96 and 2.76. The pre-2016 era appears to be structurally gone.
What happened in 2016? Several changes coincided: Google expanded featured snippets significantly, accelerated the rollout of knowledge panels, grew the People Also Ask feature, and — importantly — Semrush substantially expanded its keyword tracking database, which inflated keyword counts without corresponding traffic gains. The database expansion effect likely contributed to the apparent cliff and is addressed in the methodology section. Even accounting for this, the post-2016 efficiency floor held consistently for a decade, suggesting a genuine structural change rather than a purely measurement artifact.
The Keyword Arms Race Nobody Won
The aggregate dataset makes the inflation dynamic concrete.
Combined across all 43 publishers (2015 vs 2026):
| Metric | 2015 | 2026 | Change |
|---|---|---|---|
| Total ranking keywords | 61,535,942 | 387,832,577 | +530% |
| Total organic traffic | 822,017,625 | 1,382,598,436 | +68% |
Publishers collectively increased their ranking keyword footprint by more than six times. Traffic grew by less than one time. The ratio of traffic gained per keyword added collapsed from roughly 13:1 to roughly 3.6:1.
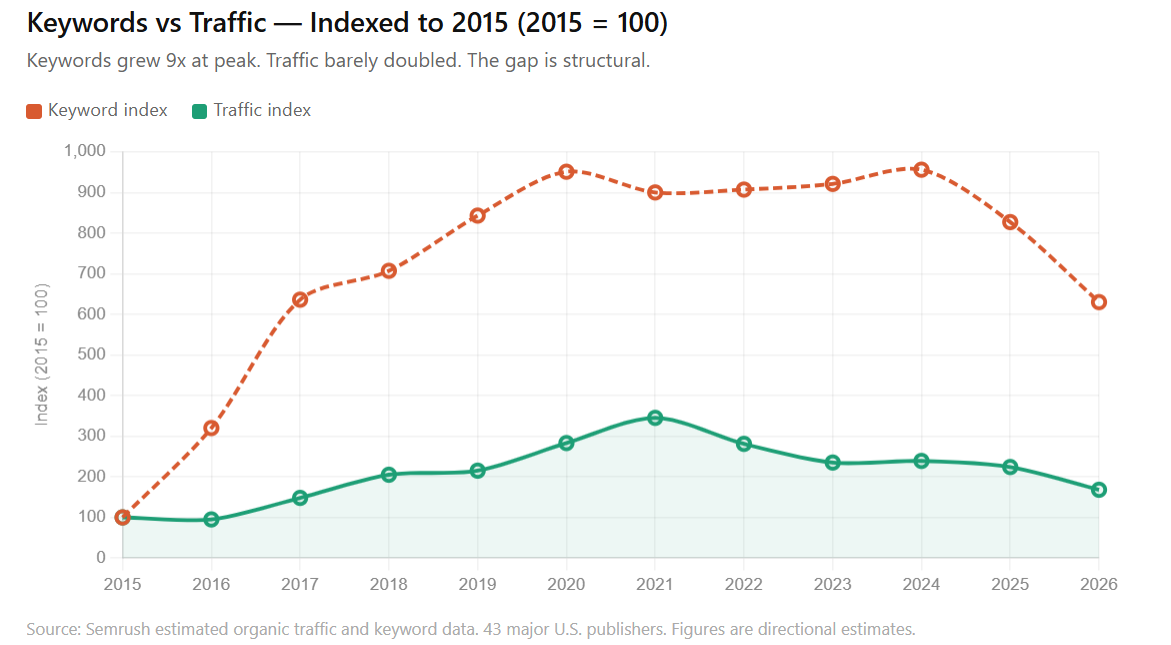
Tracking this annually makes the divergence visible:
| Year | Keyword Index (2015=100) | Traffic Index (2015=100) | Gap |
|---|---|---|---|
| 2015 | 100 | 100 | 0 |
| 2016 | 320 | 95 | -225 |
| 2017 | 636 | 148 | -488 |
| 2018 | 707 | 205 | -502 |
| 2019 | 843 | 215 | -628 |
| 2020 | 951 | 283 | -667 |
| 2021 | 900 | 345 | -555 |
| 2022 | 907 | 281 | -626 |
| 2023 | 921 | 235 | -686 |
| 2024 | 956 | 239 | -716 |
| 2025 | 827 | 224 | -603 |
| 2026 | 630 | 168 | -462 |
By 2024 publishers had grown their combined keyword footprint to nearly 10 times the 2015 level. Traffic reached less than 2.5 times the 2015 level. The gap between those two numbers — 956 versus 239 — represents the scale of diminishing returns from ranking expansion.
Of the 43 publishers in this dataset, 42 saw keywords grow faster than traffic between 2015 and 2026. Only one exception exists and it is addressed separately below.
The Peak Is Behind Them
For 32 of 43 publishers, peak traffic per keyword efficiency occurred in 2014 or 2015. For 7 publishers it occurred in 2012. Only 2 publishers in the dataset peaked after 2021.
Peak efficiency year distribution:
| Peak Year | Number of Publishers |
|---|---|
| 2012 | 7 |
| 2013 | 2 |
| 2014 | 14 |
| 2015 | 18 |
| 2021 | 1 |
| 2026 | 1 |
The concentration of peaks in 2014 and 2015 is striking. It suggests that for the overwhelming majority of publishers in this dataset, the most favorable search environment for converting rankings into traffic existed more than a decade ago.
Individual publisher efficiency: peak value vs 2026
| Publisher | Peak Year | Peak Efficiency | 2026 Efficiency | Decline from Peak |
|---|---|---|---|---|
| axios.com | 2013 | 260.12 | 2.78 | -98.9% |
| theatlantic.com | 2015 | 143.79 | 1.62 | -98.9% |
| vox.com | 2014 | 110.30 | 1.24 | -98.9% |
| theguardian.com | 2012 | 179.63 | 3.93 | -97.8% |
| bbc.com | 2012 | 293.66 | 6.78 | -97.7% |
| wsj.com | 2014 | 79.33 | 2.38 | -97.0% |
| huffpost.com | 2013 | 40.88 | 1.33 | -96.7% |
| apnews.com | 2012 | 76.41 | 2.71 | -96.5% |
| vice.com | 2012 | 27.14 | 1.34 | -95.1% |
| businessinsider.com | 2012 | 26.73 | 1.39 | -94.8% |
| bostonglobe.com | 2012 | 32.34 | 1.79 | -94.5% |
| slate.com | 2015 | 21.27 | 1.42 | -93.3% |
| miamiherald.com | 2015 | 15.77 | 1.08 | -93.1% |
| forbes.com | 2014 | 30.53 | 2.23 | -92.7% |
| newsweek.com | 2015 | 15.38 | 1.23 | -92.0% |
| cnbc.com | 2014 | 68.85 | 5.81 | -91.6% |
| propublica.org | 2015 | 8.74 | 0.75 | -91.4% |
| chicagotribune.com | 2014 | 13.56 | 1.26 | -90.7% |
| webmd.com | 2015 | 26.36 | 2.50 | -90.5% |
| cbsnews.com | 2014 | 13.31 | 1.42 | -89.4% |
| bloomberg.com | 2014 | 21.74 | 2.31 | -89.4% |
| variety.com | 2015 | 20.69 | 2.36 | -88.6% |
| politico.com | 2014 | 28.35 | 3.29 | -88.4% |
| washingtontimes.com | 2014 | 10.72 | 1.25 | -88.3% |
| sfgate.com | 2014 | 7.98 | 0.97 | -87.8% |
| time.com | 2015 | 11.04 | 1.36 | -87.7% |
| nbcnews.com | 2012 | 19.51 | 2.48 | -87.3% |
| nypost.com | 2015 | 21.33 | 2.75 | -87.1% |
| people.com | 2014 | 38.81 | 5.00 | -87.1% |
| healthline.com | 2021 | 21.33 | 2.94 | -86.2% |
| washingtonpost.com | 2015 | 16.16 | 2.27 | -86.0% |
| latimes.com | 2014 | 12.81 | 1.82 | -85.8% |
| cnn.com | 2015 | 34.13 | 5.06 | -85.2% |
| reuters.com | 2014 | 18.15 | 2.73 | -85.0% |
| thehill.com | 2014 | 15.47 | 2.59 | -83.3% |
| nytimes.com | 2015 | 27.87 | 4.88 | -82.5% |
| dailymail.co.uk | 2015 | 18.67 | 3.42 | -81.7% |
| foxnews.com | 2015 | 30.54 | 6.26 | -79.5% |
| thedailybeast.com | 2015 | 14.57 | 3.04 | -79.1% |
| npr.org | 2015 | 12.06 | 2.56 | -78.7% |
| usatoday.com | 2015 | 13.86 | 3.05 | -78.0% |
| investopedia.com | 2015 | 18.24 | 4.72 | -74.1% |
| breitbart.com | 2026 | 75.92 | 75.92 | 0.0% |
15 Publishers Lost Absolute Traffic Despite Ranking for More Keywords
For 15 of the 43 publishers, the outcome of the keyword arms race was not merely diminishing returns — it was negative returns. These publishers ranked for significantly more keywords in 2026 than in 2015 yet received less total traffic:
| Publisher | Keyword Growth 2015-2026 | Traffic Change 2015-2026 |
|---|---|---|
| theatlantic.com | +108.7% | -95.9% |
| slate.com | +50.4% | -76.0% |
| washingtontimes.com | -26.0% | -73.7% |
| sfgate.com | +16.2% | -72.0% |
| chicagotribune.com | +23.2% | -60.5% |
| wsj.com | +164.2% | -49.3% |
| forbes.com | +400.4% | -45.4% |
| dailymail.co.uk | +71.3% | -44.4% |
| time.com | +184.9% | -39.4% |
| vice.com | +243.8% | -39.0% |
| webmd.com | +531.1% | -31.8% |
| washingtonpost.com | +149.6% | -25.1% |
| bostonglobe.com | +131.2% | -9.6% |
| bloomberg.com | +266.3% | -5.3% |
| thedailybeast.com | +93.1% | -1.6% |
Forbes ranked for 400% more keywords in 2026 than 2015. Its traffic fell 45.4%. The Washington Post ranked for 149% more keywords. Its traffic fell 25.1%. WebMD ranked for 531% more keywords. Its traffic fell 31.8%.
For these publishers, expanding their ranking footprint did not offset the declining value of each individual ranking.
The YMYL Exception
Health and finance publishers followed a meaningfully different trajectory from the rest of the dataset.
While most publishers collapsed in efficiency in 2016, Healthline, WebMD, and Investopedia maintained relatively high efficiency for years afterward:
| Year | Healthline | WebMD | Investopedia | Dataset Median |
|---|---|---|---|---|
| 2015 | 13.38 | 26.36 | 18.24 | 16.99 |
| 2016 | 11.53 | 14.22 | 9.50 | 2.29 |
| 2018 | 13.00 | 21.49 | 13.29 | 2.48 |
| 2020 | 13.98 | 16.81 | 15.38 | 2.34 |
| 2021 | 21.33 | 16.09 | 17.82 | 2.76 |
| 2022 | 10.60 | 14.40 | 12.50 | 2.22 |
| 2023 | 7.60 | 7.16 | 7.38 | 2.07 |
| 2024 | 5.35 | 6.41 | 5.88 | 1.99 |
| 2026 | 2.94 | 2.50 | 4.72 | 2.48 |
When the rest of the dataset collapsed to a median of 2.29 in 2016, these three publishers held efficiency between 9.5 and 14.2. Through 2021 they maintained efficiency levels 5 to 8 times higher than the dataset median.
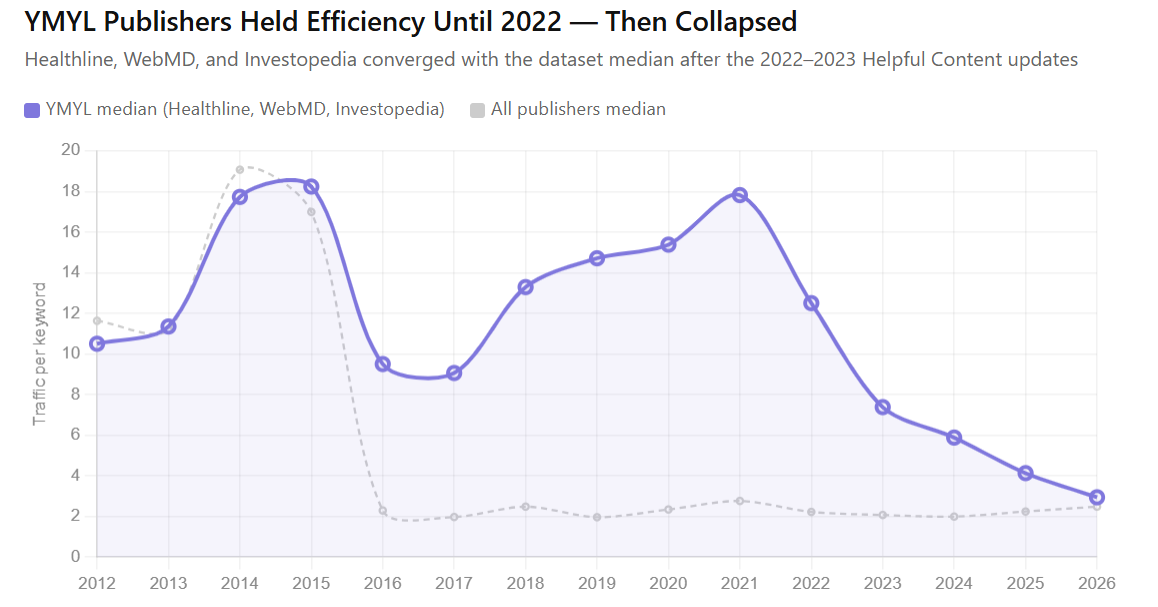
Then the 2022 and 2023 Helpful Content updates hit. In two years all three converged toward the dataset median. Healthline fell from 21.33 in 2021 to 2.94 in 2026. WebMD fell from 16.09 to 2.50.
What happened in 2016 to news publishers, Google’s quality updates did to health and finance publishers in 2022 and 2023. The mechanism may differ but the outcome is the same — efficiency collapsed toward the dataset floor and has not recovered.
The Breitbart Anomaly
One publisher in this dataset defied every trend described above.
Breitbart efficiency by year:
| Year | Keywords | Traffic | Efficiency |
|---|---|---|---|
| 2015 | 242,866 | 1,431,798 | 5.90 |
| 2016 | 1,037,056 | 1,997,386 | 1.93 |
| 2017 | 1,341,623 | 2,311,707 | 1.72 |
| 2018 | 519,968 | 4,308,470 | 8.29 |
| 2019 | 376,072 | 3,589,924 | 9.55 |
| 2020 | 110,966 | 3,216,750 | 28.99 |
| 2021 | 89,454 | 3,583,874 | 40.06 |
| 2022 | 164,093 | 2,975,257 | 18.13 |
| 2023 | 104,074 | 2,902,046 | 27.88 |
| 2024 | 78,009 | 3,094,018 | 39.66 |
| 2025 | 73,313 | 3,235,806 | 44.14 |
| 2026 | 38,598 | 2,902,288 | 75.19 |
Breitbart followed the same pattern as every other publisher in 2016 — efficiency collapsed when keyword counts expanded. But from 2018 onward something different occurred. Keyword counts shrank dramatically — from over 1.3 million in 2017 to 38,598 in 2026, an 84% reduction — while traffic remained stable near 3 million monthly visits.
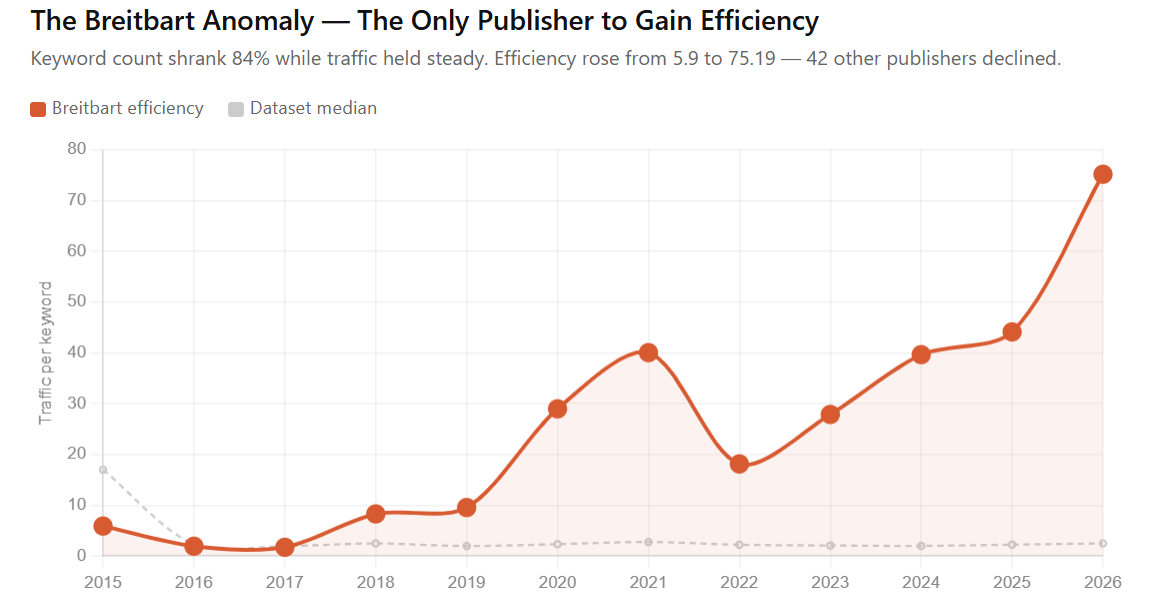
The result is an efficiency of 75.19 in 2026. The next highest publisher in the dataset is Fox News at 6.26.
This is not an SEO story. A publisher does not maintain nearly 3 million monthly visits on 38,000 keywords through search discovery. It does so through direct demand — an audience that navigates to the site deliberately, searches for the brand explicitly, or arrives through non-search channels including social media, email, and direct navigation.
Breitbart’s data represents what full independence from Google’s algorithm looks like in practice. It is the only publisher in this dataset that built or maintained a traffic base that does not depend on ranking for a large volume of keywords.
Whether this model is replicable depends entirely on whether a publisher can build that level of direct audience demand. The data does not suggest it is easy. It does suggest it is the only model that produced efficiency gains across the 14-year period studied.
What the AI Era Actually Shows
The current public narrative frames AI Overviews as the primary threat to publisher traffic. The efficiency data complicates this framing.
Median efficiency 2022 vs 2026:
- 2022: 2.22
- 2026: 2.48
- Change: +11.9%
The AI era in this dataset — defined as 2022 through 2026 — shows a slight median efficiency increase, not a decline. The catastrophic damage to publisher efficiency was done in 2016. The baseline that AI Overviews inherited was already devastated.
This does not mean AI Overviews have had no effect. Some publishers show accelerating declines post-2023 that may reflect AI Overview cannibalization of specific query types. Individual publisher results vary. But in aggregate, the efficiency floor established in 2016 held through the AI era. There was no second cliff.
The data suggests the conversation about AI and publishing has been focused on the wrong time period. The structural break did not happen in 2024. It happened a decade earlier.
Conclusion
Fourteen years of efficiency data across 43 publishers produce three findings that are difficult to contest.
First, traffic per keyword efficiency collapsed 86.5% in 2016 and never recovered. Whatever the cause, the pre-2016 relationship between ranking and receiving traffic no longer exists.
Second, publishers responded to declining efficiency by expanding keyword footprints. This strategy produced diminishing returns at scale — 530% more keywords yielded 68% more traffic — and for 15 publishers produced negative returns, with absolute traffic falling despite more rankings.
Third, the only publisher in this dataset to gain efficiency over the study period did so by shrinking its keyword footprint while maintaining traffic through direct audience demand. Every other publisher lost efficiency from its individual peak, with declines ranging from 74% to 98.9%.
The deal between Google and publishers — rank for our queries and we will send you traffic — still exists in a technical sense. Rankings still produce some traffic. But the terms of that deal changed fundamentally in 2016, and the data suggests they have not changed back.
Methodology
Data source: Semrush estimated organic traffic and organic keyword counts (top 100 positions) for 43 root domains.
Time period: January 2012 through May 2026, covering 173 consecutive months.
Efficiency calculation: Monthly traffic per keyword = organic traffic estimate divided by organic keyword count for the same month. Annual figures represent the mean of monthly values within each calendar year.
Publisher selection: 43 major U.S. digital publishers across news, sports, entertainment, health, and finance categories. The dataset is not exhaustive and skews toward established publishers. Findings should not be extrapolated to represent all web publishing.
Known limitations:
- Semrush estimates are directional, not first-party measurements. Individual publisher figures may differ materially from actual analytics data.
- Semrush expanded its keyword tracking database significantly in 2016 and again in subsequent years. This expansion inflated keyword counts independent of actual ranking changes, which contributes to the apparent 2016 efficiency cliff. The post-2016 floor persisting for a decade suggests a genuine structural change, but the magnitude of the 2016 drop should be interpreted with this caveat.
- Branded versus non-branded keyword segmentation is not available in this dataset. Publishers with stronger brand search demand may show artificially higher efficiency. Cross-publisher comparisons of absolute efficiency levels are less reliable than within-publisher trend analysis.
- Top 100 keyword rankings are included. Publishers optimizing for top 3 positions specifically may show different efficiency patterns than this dataset captures.
- Correlation does not imply causation. This study identifies patterns in the data. It does not establish that any specific Google product or policy change caused the observed efficiency changes.
Aggregate figures use median efficiency to reduce the influence of outliers. Publisher-level figures use annual means of monthly data.
Research by XSquareSEO — an SEO agency specialising in niche-specific SEO for businesses across India. Dataset assembled May 2026. All Semrush figures are estimates. Full publisher-level data available in the table above.